


Ian Goodridge and Christian Betts of Arcadis unpack the latest trends in international construction costs as the world reacts to US tariffs amid persistent inflation and high borrowing costs
01 / Introduction
A year of change, 2024 certainly lived up to its billing as the “year of democracy”, with more than 60 countries holding elections. The combination of persistent inflation and wider social upheaval fed voter dissatisfaction, bringing about major shifts in the global political order.
The year was also a significant turning point as interest-rate cycles turned. However, the prediction that 2024 would see a recovery of the global construction sector, with lower borrowing rates leading to a revival of investment, failed to materialise. Instead, hopes for recovery were quickly extinguished by a combination of persistent inflation and higher long-term borrowing costs. Even modest forecasts for growth have now been downgraded in the face of an escalating tariff war.
The rapid shift in sentiment means that, five years after the pandemic, many development markets continue to face significant headwinds, particularly around affordability and viability. With private investment retreating, public spending is likely to play a bigger role in 2025 and 2026, particularly in defence, housing and social infrastructure. New political leadership will bring forward significant changes in economic and investment policy, evidenced already in the US, Germany, the UK and beyond.
Meanwhile, the reciprocal tariff regime unleashed by US president Donald Trump brings with it an additional source of tension. While construction may be relatively insulated, relying heavily on local, low-value materials such as cement, certain risks remain, particularly in supply chains for globally sourced equipment like switchgear. Cost escalation is a real concern and, as diverted goods flood global markets, further instability may follow.
02 / The cost index snapshot
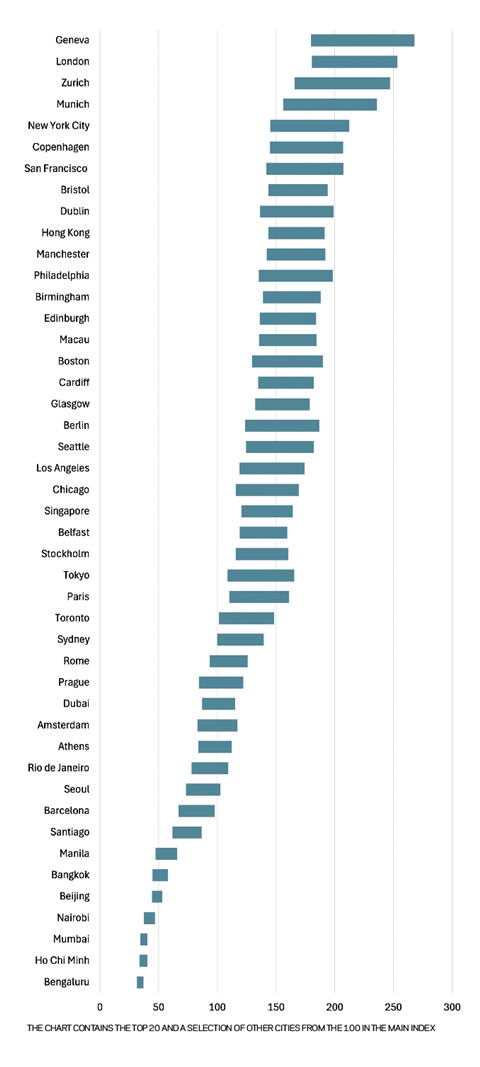
The Arcadis ICC index for 2025 covers 100 locations. The data was collected in the first quarter of 2025. Projects delivered in accordance with local specification standards are compared on the basis of conversion to US dollars.
Geneva has returned to the top of the index, driven by construction inflation of 4% last year, coupled with the relative strength of the Swiss franc as a safe haven currency in turbulent times. London maintained its position in the top two, with cost rises still being driven by specification enhancements and new process requirements such as the gateway reviews for high-rise housing. Currency fluctuations also mean that Dublin, the second-most expensive city in the Eurozone after Munich, is ranked ninth. There are now two US cities in the top 10, with Philadelphia dropping five places to 12th. Indeed, lower rates of inflation and the weak dollar have led to lower rankings for most US cities. Hong Kong also fell to 10 in the rankings.
Inflation in 2024 appears to have been affected mostly by labour availability leading to greater levels of variability at a local level. This can be seen in the US, where inflation ranged from around 1% in low-demand locations like New York and San Francisco, to over 5% in Miami where residential and commercial markets are more buoyant. Until recently, commodity markets have been largely stable, although they have fallen in recent weeks in response to fears about global growth prospects.
Hong Kong’s ranking fell as a result of flat prices and its currency peg with the US dollar. By contrast, prices have been moving sharply upward in Australia, where a modest recovery in workload combined with falling labour productivity has triggered inflation levels ranging from 3% to 10%. Other inflation hotspots include Eastern Europe, where inflation in Sofia and Zagreb reached double figures, as well as Tokyo, with construction prices increasing at 9%, and Lagos, where prices rose by over 70% because of the wider economic crisis. Western Europe is still exposed to many headwinds but there are some signs of recovery, particularly in Amsterdam, the datum for the ICC index, where prices increased by 3%.
Looking ahead, most markets are forecast to have stable to moderate inflation in 2025 as accelerated investment cycles associated with energy transition, network investment and real estate decarbonisation are likely to be tempered by further delay to recovery in cyclical building sectors such as housing, given raised levels of geopolitical turmoil and its impact on global economic growth.
Figure 1: International Construction Costs Index 2025
03 / Regional analysis
US
The US construction sector has been growing at around 4% a year and was boosted in particular last year by public sector work. However, the outlook for 2025 is much less certain, particularly for public sector construction, where the new administration is likely to review its capital spending priorities, leading to a delay in approvals at best, and the potential for cancellation of some programmes. Nervousness around tariffs is also a concern as uncertainty impacts decision-making in the private sector.
So far, while the rate of investment spend may have dropped slightly and schedules may be a little less aggressive, overall the long-range plans for many mega-projects remain intact. The main problem is that these projects are difficult to resource. Large schemes such as data centres in remote, small-state markets with limited labour supply have seen the greatest price pressure.
Inflation averaged 2.7% in 2024, ranging from 1%-2% in low-demand locations such as California to over 5% in Florida, where residential and commercial markets were stronger. For 2025, the outlook points to a lower overall average of 2.4%.
Australia
The Australian construction market was subdued in 2024 as costs remained stubbornly high, underpinned by significant labour and skills shortages. One of the biggest challenges last year was the steep and continued decline in construction productivity, with workers averaging less than three days of productive work a week, less than half the levels seen in the pre-pandemic era.
Tender price inflation averaged 6% across the key Australian cities in 2024 and is currently forecast to be slightly lower at about 5% in 2025, although the potential for disrupted trade flows following any US trade disputes could increase domestic material costs if supply chains are challenged.
The outlook for 2025 is that the market is expected to grow from mid-year, boosted by large-scale mixed-use precinct projects close to rail transit hubs in New South Wales, Victoria and Queensland, together with procurement activity on Olympic venues. Key to getting projects moving will be tackling the productivity issues head-on in order to meet ambitious housing and infrastructure targets.
China
The Chinese construction sector expanded by 3.9% in 2024 which, while positive, was below the 5.8% recorded in 2023 and continued the year-on-year decline in rates of sector activity in recent years.
Output was mainly driven by government-funded activity in infrastructure as the beleaguered private residential market remained lacklustre, with rates of urbanisation slowing considerably and many developers struggling to find work for their builders once existing projects complete. This looks set to continue into 2025, given that new home starts fell by almost 30% in the first two months of 2025, against a year earlier. More positively, construction of giga-factories seems to be proceeding as planned, with no major obstacles reported.
Most Chinese cities in the ICC index saw construction deflation of about 2% in 2024, following a 2%-3% contraction in 2023, as the turmoil surrounding the real estate market continued for a fourth year. Recent reports suggest property sales in 30 of China’s largest cities fell by 16% year-on-year in the first six weeks of 2025. To prevent further deterioration the central government is looking at potentially supporting developers through direct acquisition of housing units. Current forecasts suggest annual construction inflation will be flat at best in 2025.
On the upside, upgrades and functional transformation of real estate assets, which we first highlighted last year, continues to be a growth area, driven by demand for greener, smarter buildings and efforts to meet targets in China’s decarbonisation roadmap.
>>> Also read: Market forecast: Why viability is tight for construction projects in the UK
>>> Also read: Cost model: What solutions are there for low embodied carbon office fit-outs?
EU
Latest data from Eurostat suggests that construction output by volume in the EU fell on an annual basis by 1.5% in 2024, as a series of familiar headwinds including struggling economies and geopolitical concerns continued to hold back sector activity, particularly in the long-suffering residential market. Current Euroconstruct forecasts indicate that marginal growth of 0.6% is likely in 2025, increasing to 1.8% in 2026, driven by transport and energy infrastructure activity in particular.
Germany’s construction industry – the largest in the EU – continued to face challenges in 2024, with the sector continuing to be affected by labour and material cost inflation and elevated interest rates, which collectively dampened demand and led to further insolvencies among major developers. The major bright spot for later in 2025 and beyond should be economic and social infrastructure, with the new German government managing to pass a €500bn plan to modernise hospitals, schools, roads and energy networks.
The Irish construction market is poised for recovery in 2025 following a challenging previous 12 months, particularly in the housing sector. The government’s National Development Programme is set to accelerate, with major housing and hospital projects progressing in procurement.
Among the most positive construction markets in the EU in 2024 were Spain and Portugal, where strong investment in infrastructure, hospitality, residential, data centres and giga-factories saw strong growth compared with most of of their peers in the EU bloc.
04 / Global insolvency trends
Last year, we looked in more detail at one of the key themes emerging in many countries – that of the notable rise in construction company insolvencies and bankruptcies. We highlighted that this trend was prevalent in the UK and other parts of Europe, as well as further afield in Canada and Australia, and could lead to the potential for supply chain failure rising up the project risk register. So, 12 months on, has anything changed?
It is worth noting that the terms “insolvency” and “bankruptcy” are often used interchangeably. While they can mean different things in different countries, the trends are nevertheless similar. The data used in this segment refers to official insolvency figures in the UK, Germany and Australia and to bankruptcy figures in other countries.
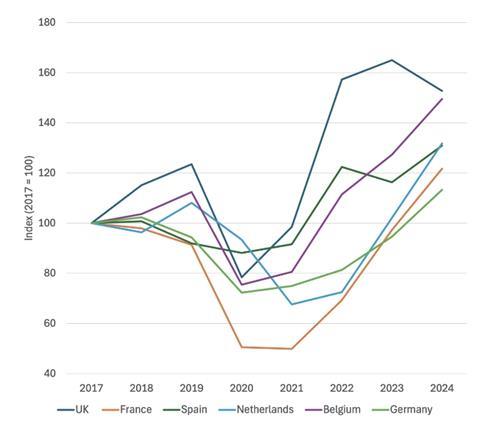
Table 1 shows that double-digit annual rises in construction insolvencies or bankruptcies continued to be a feature in most markets in 2024. France, Germany, the Netherlands and Australia all saw rises of 20% or above, while in Canada, the 2024 total was an increase of 30% on 2023 levels and 40% above the long-term trend since 2015. Even Spain saw a 13% annual rise, despite the construction sector there experiencing strong growth in 2024 compared with many of the country’s European neighbours.
Table 1: Levels of construction industry bankruptcy in Europe and beyond, 2023 to 2024
| 2023 | 2024 | Change | |
|---|---|---|---|
| Netherlands | 479 | 618 | 29% |
| France | 11,813 | 14,771 | 25% |
| Germany | 2,216 | 2,652 | 20% |
| Belgium | 2,230 | 2,619 | 17% |
| UK | 4,574 | 4,234 | -7% |
| Spain | 763 | 859 | 13% |
| Australia | 1,541 | 1,952 | 27% |
| Canada | 681 | 886 | 30% |
The familiar tale of causation factors included the continued rise in labour costs and the impact of higher interest rates on both project viability and debt servicing. It can be hoped that the series of interest rate cuts seen in Europe and Canada towards the latter half of 2024 will eventually act as a brake on construction insolvency numbers.
The one glimmer of positivity came from the UK, where the overall total of construction insolvencies in England, Wales and Scotland in 2024 was 7% down on the peak seen in the previous year. This was the only country in our sample set to see a fall last year.
Might this be the turning point or is it just a blip? Alas, the latest Red Flag Alert report from insolvency specialist Begbies Traynor would suggest the latter. It showed that in the last quarter of 2024 there were over 6,800 construction companies in “critical” financial distress – often a precursor to formal insolvency – a quarterly rise of 58%, although down 14% from the same period in 2023. A further 97,600 UK construction firms were in “significant” financial distress – the highest quarterly total in the last 2.5 years, suggesting continued high levels of business failure before any respite kicks in.
Figure 2: Construction insolvency levels in selected European countries
About the Construction Costs Index
The Arcadis International Construction Cost Index offers a comparison of building costs across 100 global cities. The report provides regional construction market insights and highlights examples of investment priorities in major cities around the world. This article includes data for 45 cities. The full report, published in May 2025, can be accessed via arcadis.com.
The index is based on a survey of construction costs of 20 building types, based on local specifications and denominated in US dollars to enable comparison. The index compares the costs of delivering a building function in different locations rather than a like-for-like comparison of the costs of a similar type of work.
05 / Impact of tariffs
At time of writing, in mid April, there have been no changes to tariff measures put in place by the UK and Europe, except for measures to prevent the dumping of low-cost steel and aluminium into domestic markets.
US tariff policy is being driven by multiple objectives, including the correction of trade imbalances, revenue-raising and specific policy aims related to drugs, migration and sanctions. The complexity of the US tariff agenda adds to its unpredictability and, as a result, to the wider impact that trade barriers could have on investment and growth.
The short-term impact of tariffs is likely to be higher prices in the US and potentially also Canada. In the medium term, investor uncertainty is an important issue. Outside the US and Canada, the indirect impact of tariffs on growth is probably more impactful for construction than the direct impacts of tariffs on prices.
Trade barriers are not currently expected to send the global economy into reverse, but in its first assessment of the impact of tariffs, the IMF has downgraded its global growth forecast for 2025 from 3.3% to 2.8%, with the UK forecast to see annual growth of 1.1%, down from 1.6% predicted in January.
Potential impact on construction
Construction typically relies on a domestic materials supply chain for most inputs. Construction materials are typically heavy and low-value, meaning that transport costs play an important role in determining the location of a supply chain. Even if tariffs were to be applied, the impact is likely to be lower than for other sectors, such as automotive or clothing, where global trading is more significant.
The UK and Europe have well-developed construction materials and equipment supply chains. The value of imported construction-related materials into the UK, for example, is £23bn. Some 60% are sourced from the EU, the UK’s nearest trading partner. The US is not a top 10 supplier . At least 25% of UK imports by value fall into categories such as lamps and fittings, and air-conditioning equipment, where there is a circular, cross-border trade with EU-located firms associated with project finishing.
The US also has a construction supply chain that is closely integrated with Canada, where tariffs could have a big impact on circular trade patterns. “Buy Canadian” campaigns could also lead to scarcity-driven price escalation.
At the time of writing, few retaliatory tariff regimes have been announced in response to US proposals. This means most impacts will be felt in the US and possibly Canada. China’s stand-off is the exception.
Deflation risks outside the US
Outside the US, the wider disruption to global trade triggered by tariffs could have further cumulative effects. These include a slowdown in foreign direct investment (FDI) and also the redirection of products away from the US, resulting in oversupply and lower prices.
A slowdown in FDI will result in a reduction in investment in manufacturing facilities in offshore locations like Ireland until there is greater clarity on tariff and trading policy and the longevity of the US administration. Doing nothing may be the best option.
With respect to product dumping, the EU and UK have already acted to protect domestic aluminium and steel manufacturers from unfair competition. The World Trade Organisation permits protection measures including anti-dumping measures, which prevent importers from selling products at prices lower than on home markets.
Safeguarding measures are also available which provide for a temporary restriction on the import of specified products from all suppliers while the domestic industry adjusts. The unintended impacts of safeguarding measures could be a restriction on the availability of products from preferred suppliers outside of the UK or the EU.
Summary
Construction is less exposed to the impact of tariffs globally, compared with other sectors. The redirection of products from US to other markets by low-cost importers has the potential to be highly disruptive. Although the immediate effect could be downward pressure on prices, the indiscriminate nature of trade remedies could result in import restrictions affecting existing import supply chains.
In response to tariff barriers, some suppliers could choose to increase prices globally to compensate for barriers raised by the US and China, but there is little sign of this so far.
The main watch-out for construction businesses is the wider impact of tariffs on growth and demand. If the market does slow, ultimately construction could find itself far more exposed than would initially appear to be the case.
06 / Currency trends
The long-held view of the US dollar as a safe haven in times of market stress has been undermined as erratic US policy-making and rising trade barriers jeopardised confidence in the currency.
The impact of recent currency movement against the US dollar became a significant factor as the ICC rankings for 2025 were compiled. The strength of the Swiss franc and the euro saw Geneva rise to the top of the rankings, while Dublin moved up 10 places to ninth. Meanwhile, stronger sterling boosted the position of UK cities.
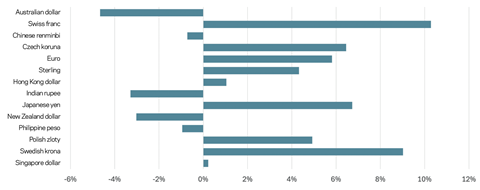
In contrast, the majority of the US cities saw their rankings fall, including Philadelphia which dropped five places to 12th, while a 5% fall in the Australian dollar versus the US benchmark saw Antipodean cities like Brisbane and Melbourne drop down the index, despite construction inflation of 3%-6%.
The chart plots the movement of a range of currencies against the US dollar. In the 12 months to mid April 2025, the Swiss franc appreciated by over 10%, the euro by almost 6% and sterling by over 4%. In contrast, the Australian dollar fell by close to 5% and the Chinese renminbi fell by 0.7%.
Figure 3: Currency movement versus US dollar, April 2024 to April 2025 (%)
07 / Commodities and energy prices
After record highs in 2022 and sharp contractions in 2023, wholesale electricity prices declined further in many countries during 2024. While this downward trajectory largely tracked the fall in global energy commodity prices, there were some diverging regional trends. The International Energy Agency (IEA) reported that the EU, the UK and the US all posted around 20% lower wholesale electricity prices on average in 2024 compared with the previous year.
However, while prices in the EU were still 40% higher than the 2019 average, prices in the US were close to parity with pre-covid levels. In effect, the average EU wholesale electricity prices were still more than twice (+130%) the US level in 2024, still well above the pre-covid difference of around 70%. This makes EU energy-intensive industries far less competitive against their US counterparts.
The IEA reported that global energy demand rose by 2.2% in 2024, almost twice the average annual demand increase of 1.3% between 2013 and 2023. After several years of decline, advanced economies saw a return to growth, albeit at just under 1% in aggregate. Emerging and developing countries accounted for more than 80% of the overall global energy demand in 2024, despite energy consumption rising by less than 3% last year in China, less than half its 2023 rate.
Much of the increase in global energy demand growth in 2024 was led by the power sector, with the world’s electricity consumption surging by nearly 1,100TWh, or 4.3% – nearly double the annual average over the past decade. Some 60% of that total growth last year was in buildings, with consumption rising by more than 600TWh (5%), linked to demand for-air conditioning and power for new data centres.
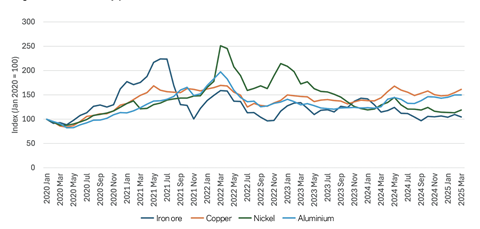
Figure 4: Commodity price indices, 2020 to 2025
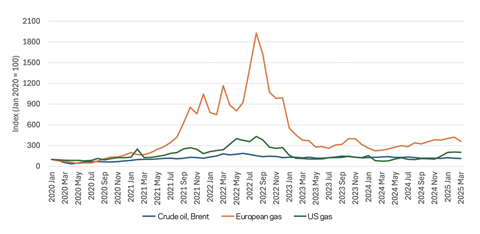
Energy costs have fallen dramatically in the early part of 2025 in anticipation of a slowdown in the global economy and increased production by OPEC members. With Brent crude prices down by 15% in April alone, prospects for lower inflation in 2025 are strengthening.
Commodity prices diverged in 2024, with copper and aluminium trading at about 10% above their long-term trend. The most recent outlook from the World Bank, admittedly published in October last year, projected falls of 5% in 2025 and 2% in 2026. This would lead aggregate commodity prices to their lowest level since 2020, albeit they would still be nearly 30% above the 2015-19 average.
At the time of writing, the US tariff trade dispute is in the early stages of a 90-day pause. However, the uncertainty created is causing many analysts to predict significantly lower global growth in 2025, especially if a face-off between the US and China continues. This will in turn dampen demand for metal commodities such as copper and energy commodities such as oil. Copper prices rose by 6% in 2024 and climbed a further 5% in the first quarter of 2025. However, those gains were wiped out in the first week after US president Donald Trump’s “liberation day” announcements in early April.
Figure 5: Energy commodity price indices, 2020 to 2025
07 / Conclusions
The most positive outcome from 2024 is that most economies managed their transition to economic stability – avoiding recession even as the interest cycle peaked. However, inflation has proved persistent, and long-term borrowing costs for governments and corporations in many parts of the world have increased, creating further headwinds, in particular for sectors that are sensitive to debt costs or investment yields.
Despite such challenging times, some construction markets can be expected to boom. From advanced manufacturing in the US and Asia, to energy transition programmes in the UK and Europe, contractors are reallocating resources to meet shifting demand. This is creating fresh competition for labour and materials – especially in traditional sectors like housing, commercial and social infrastructure. The good news is that most development markets show strong underlying demand, whether for modern, near-zero carbon office space, data centre capacity or housing. Given the prospects of falling interest rates, if clients and their teams can meet their viability hurdles by optimising every stage of the development process, it is likely a recovery will follow.


No comments yet